
“… all living systems are complex – i.e., highly nonlinear – networks …” Fritjof Capra
CH4= Methane, CO= Carbon monoxide, CO2= Carbon dioxide, OH = hydroxyl radical
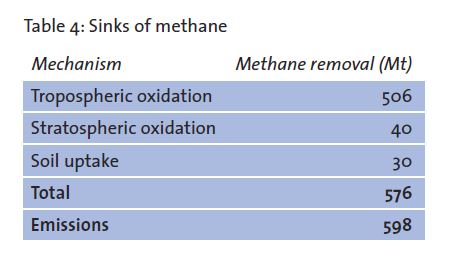
There’s a fundamental problem with methane analysis, and that is most methane analysis only looks at the emissions side of the ledger.
Methane, unlike CO2, has two sinks- a small geospheric (soil) sink and a much larger tropospheric (hydroxyl radical) sink. In the soil sink, methanotrophic bacteria oxidize methane back to H2O and cyclical CO2. This accounts for approximately only 5% of atmospheric methane oxidation, though this soil sink keeps a lot of methane from being released into the atmosphere. Methane is released from a number of sources including termites, arthopods, phytoplankton and anywhere else methanogenic archaea exist (Lakhani 2018, Hacksteinet et al 1994, Klintzsch et al 2019). As a quick side, note: Tillage, nitrogen fertilizers, bare fallows, etc all destroy methanotrophic bacteria (Singh et al 2015). The much larger sink for methane is the hydroxyl radical sink in the lowest part of the atmosphere, the troposphere (Prinn 2014). So the amount of methane in the atmosphere is also a function of how many hydroxyl radicals are available to oxidize methane (Rigby et al 2017).
Hydroxyl radical [OH] availability is impacted by a number of factors including the presence of other trace gases and by the availability of tropospheric ozone as well as the water vapor and monoterpenes (e.g. isoprene) emitted from plants. Other trace gases like carbon monoxide [CO] use up hydroxyl radicals making less OH available for methane oxidation. So smoldering fires, that produce a lot of CO, impact atmospheric CH4 levels (Rowlinson et al 2019). Thus reducing fires, through grazing for example, increases hydroxyl radical availability for the oxidation of methane.
In order to make hydroxyl radicals, you need tropospheric ozone. This form of ozone is normally considered a pollutant, but like most things it’s not necessarily bad in the correct context. In order to form tropospheric ozone naturally, you need biogenic volatile organic compounds [BVOC’s] which are monoterpenes emitted from the stomata of plants under heat stress like isoprene and pinene. These BVOC’s interact with nitrites emitted from soils to form NO3 which gets zapped by light to form ozone. (Monk et al. 2015). That ozone in turn is zapped by light to form oxygen (O2) and excited oxygen (O) and the excited oxygen in turn interacts with water vapor to form 2 hydroyxl radicals molecules (Prinn 2014)..
Where does a lot of the water vapor come from? In large part from the transpiration of plants, that’s where. (Shell 2018). So as landscapes are dehydrated and desertified, there is less water vapor and BVOC’s and thus less formation of tropospheric ozone and hydroxyl radicals, Therefor, in turn, there’s less oxidation of methane in the troposphere and thus methane is more persistent. So in addition to well managed grazing reducing fuel loads for fire, well managed grazing also increases vegetation via improved soil health and hydrology, and thus increases water vapor and BVOC’s for hydroxyl radical formation. Poorly managed grazing, on the other hand, has the opposite impact. So once again, as Russ Conser once noted, it’s not the cow, it’s the how.
Capiche?
Now people can argue until they’re blue in the face how many wild ruminants once roamed the planet. The Hristov 2012 paper often cited has broad ranges for bison from 30 mill to 70 mill in North America. The number of auroch, stepped bison and wisent across Asia and Europe are even more speculative for the Pleistocene and Holocene periods (van Vure, 2005). The reality is we really don’t know with any certainty what the numbers were. Even in North America, which was more recent, the numbers are all based on anecdotal journals of explorers and trappers. No one was flying around in helicopters doing aerial surveys back then.
What is a little more recent is the amount of wetlands that have been drained primarily for agriculture. Wetlands and peat bogs are one of the largest biogenic sources of methane. Anthropogenic equivalents of wetlands are rice fields and hydrogen electric dams where anoxic environments created by flooding produce a lot of methane. We use to have a lot more wetlands and peat bogs…a lot lot more. In California, 95% of its wetlands have been drained in the past 150 years. Across North America and Europe, some of these wetlands were created by beavers building dams and flooding landscapes. Some estimates put the number of beaver ponds across the United States prior to the extirpation of beavers by fur trappers at somewhere between 150 to 250 million ponds (Goldfarb 2018). Beaver damns are anoxic environments that produce a lot of methane (Whitfield et al 2014). So, if some people apply the same reductive logic to wetlands and beavers as they do to ruminants, the reduction of wetlands and eradication of beavers should mean an overall reduction in atmospheric CH4. But this reductive thinking is incredibly stupid because wetlands and peat bogs are also huge carbon stores. Plus beavers rehydrating landscapes provide a number of other ecosystem benefits and services including providing fire breaks for forest fires. Thus beavers also increase hydroxyl radical availability by increasing the amount of water vapor available and reducing carbon monoxide emissions from fires.
Though many of the same people, who on one hand are saying that we need to reduce the number of cattle, are on the other hand saying we have to restore wetlands and peat bogs. Why? Because they’re taking a reductive view of cattle treating them like tail pipes, while taking more of a system view of wetlands and peat bogs taking into account the trade offs of CH4 versus CO2. When you stop treating cattle like tail pipes and put cattle back into a system or ecosystem context, the methane numbers tell an entirely different story, especially since pretty much all the methane is oxidized back to cyclical CO2 and water over a relatively short time frame via tropospheric hydroxyl oxidation as described in my prior blog post, WTF happens to all that methane?
So cattle and other ruminants are recycling the same carbon over and over again rather than adding to the atmospheric load of methane. Cattle are doing this while simultaneously drawing down atmospheric CO2 via the microbial carbon pump [MCP], especially when cattle are managed properly with AMP or HPG grazing management (Stanley et al 2018). The MCP, also known as the liquid carbon pathway, pumps a portion of CO2 converted to glucose via photosynthesis out the tips of plants roots via fungi networks into the soil to feed soil microbes in exchange for macro and micro-nutrients (Liang et al 2017). The microbes poop and die, and this poop and necromass is a large portion of what becomes soil organic matter which is 50% soil carbon stored deeply in the soil (Liang et al 2019). This deep carbon, unlike shallow or labile carbon, does not get saturated since more soil organic matter is being formed.
Anyway, I discussed some of this need for a systems view of enteric methane in my blog post I wrote back in 2018, Ruminations: Methane math and context. Readers, if you haven’t read this blog post, please do. In general, we really have to put parts back into the context of wholes. Or, in other words, we have to think more holistically.
References:
Lakhani, N et al. 2017. Methanogenesis: Are ruminants only responsible: A review
Hackstein, J. H. and Strumm, C.K. 1994. Methane production in terrestrial arthropods.
Klintzch, T et al 2019. Methane production by three widespread marine phytoplanktonspecies: release rates, precursor compounds, and potential
relevance for the environment
Singh, J.S. et al. 2015.Methanotrophs and CH4 sink: Effect of human activity and ecological perturbations. Climate Change and Environmental Sustainability
Prinn, R.G. 2014 Ozone, Hydroxyl Radical, and Oxidative Capacity
Rigby et al 2017. Role of atmospheric oxidation in recent
Rowlinson, M et al 2019 Impact of El Niño Southern Oscillation on the interannual variability of methane and tropospheric ozone.
Monk, P.S. et all. 2015. Tropospheric ozone and its precursors from the urban to the global scale from air quality to short-lived climate forcer
Shell, D. 2018. Forests, atmospheric water and an uncertain future: the new biology of the global water cycle
Hristov, A.N. 2012. Historic, pre-European settlement, and present-day contribution of wild ruminants to enteric methane emissions in the United States.
van Vure, Cis 2005. Retracing the Aurochs.
Goldfarb, B. 2018 Eager: The Surprising, Secret Life of Beavers and Why They Matter
Whitfield, C.J. et al. 2014 Beaver-mediated methane emission: The effects of population growth in Eurasia and the Americas.
Stanley et al. 2018 Impacts of soil carbon sequestration on life cycle greenhouse gas emissions in Midwestern USA beef finishing systems
Liang, C. et al 2017 the importance of anabolism in microbial control over soil carbon storage
Liang, C. et al. 2019. Quantitative assessment of microbial necromass contribution to soil organic matter.

compelling
LikeLike
decent scientific view, thank you!
LikeLike